How Did White Men and Women Vote in 2024?

How did whites in different parts of the country vote in the 2024 Presidential election? There is usually analysis of how different age groups vote, how the sexes vote, and sometimes even how whites of different religious denominations vote, but seldom of how whites vote by region. Although in our circles, it is common to regret that women do not vote Republican as often as men, the white vote is determined more by region than by sex. Regional differences can be very large.
Data and Methods
We got our 2024 exit-poll data here. It is true that exit polls can shift a point or two for particular states in the future, but not enough substantially to change the regional and state differences we present here. We divided the country into regions that we called Pacific Coast, Interior West, Midwest, Alaska, Northeast, and South.
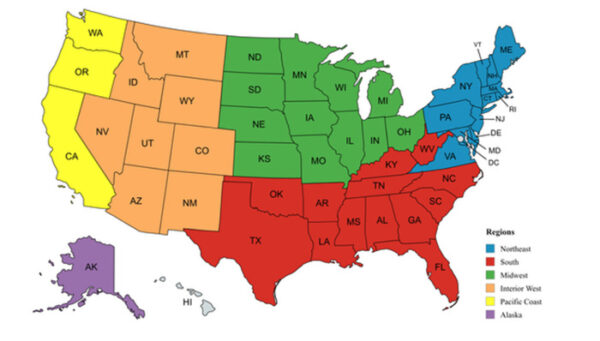
We put Alaska by itself because it is too conservative to be grouped with the rest of the Pacific Coast. We didn’t include Hawaii because the exit-poll data are incomplete. Virginia is politically unlike the rest of the South (it had the smallest percentage of whites in that area who voted for Trump), so we grouped it with Northeast, to which it is more similar. We did the same with Maryland, which was long considered culturally part of the South, but is now more like the Northeast.
Regions
In all regions, white men were more likely than white women to vote for Mr. Trump. However, there were larger differences between regions than between the sexes. The whites least likely to vote for Mr. Trump were, in order, white women on the Pacific Coast (40 percent), white women in the Northeast (43 percent), white men on the Pacific Coast (45 percent), and white men in the Northeast (52 percent).
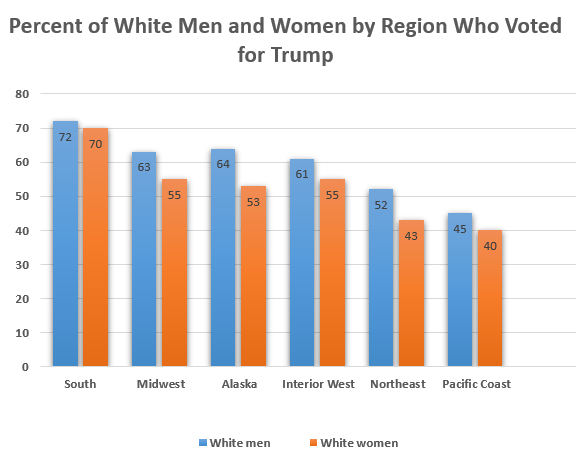
The two groups that voted for Trump in the highest percentages were white men (72 percent) and women (70 percent) in the South. These are very substantial regional differences.
States
The South was the only region with states in which 80 percent or more white men or women voted for Mr. Trump: both sexes in Mississippi, women in Alabama, and men in Louisiana. Also, it was only in the South (Alabama, Mississippi, and Georgia) where more white women than men voted for Mr. Trump. Outside the South, the Interior West was the only region with a state (Wyoming) that reached 70 percent or above (73 percent for white men and 72 percent for white women).
The Midwest didn’t have any state that reached 70 percent for either sex, nor did Alaska. In the Northeast, no state reached 60 percent for either sex, and on the West Coast, neither sex even reached 50 percent. Vermonters were least likely to vote for Mr. Trump (white women 30 percent, white men 37 percent). Again, these are very substantial differences.

Voting gaps between white men and women
The South had the smallest gap between white men and women at 2 percent, with both sexes voting overwhelmingly for Mr. Trump. The second smallest gap was for the Pacific Coast at 5 percent, with majorities of both sexes voting against him. Alaska had the largest voting gap at 11 percent, with both sexes voting mostly for Mr. Trump. The next largest gap was in the Northeast at 9 percent, with a small majority of white men voting for Mr. Trump, and white women voting mostly against him. Details for all regions are here.
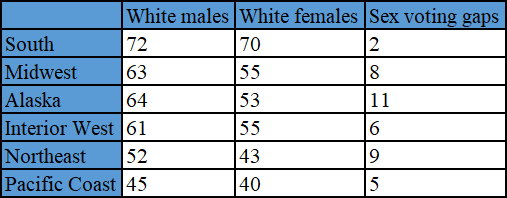
As for individual states, Rhode Island had the largest voting gap between men and women: 19 percent, followed by Connecticut at 18 percent. In both cases, 55 percent of white men voted for Mr. Trump, while women voted heavily against him. New York and Illinois both had voting gaps of 14 percent, with white men voting for Mr. Trump, and women mostly against him. Delaware had a voting gap of 13 percent, with the same split as in the other states. This kind of divide was most common in the Northeast, and was either extremely rare or never occurred in the other regions. The Northeast also had the largest state voting gaps by sex. Alaska, New Jersey and Nebraska had voting gaps of 11 percent, with both sexes in Alaska and Nebraska voting mostly for Trump. In New Jersey, a majority of white men voted for Trump and a majority of white women voted against him. (Table 1).
None of the states in the South, Pacific Coast, or Interior West had voting gaps greater than 10 percent. In the South and Interior West, majorities of both white men and women voted for Trump in just about every state, with the exception of New Mexico and Colorado. In New Mexico, white men and women split in opposite directions, while in Colorado, both white men and women voted mostly against Mr. Trump (Table 1).
On the Pacific Coast, all gaps were at or under 10 percent, and majorities of both white men and women voted against Mr. Trump. The South and Alaska were the only regions in which, in all states, majorities of both white men and women voted for Mr. Trump (Table 1).
Voting gaps between regions
The voting gaps between regions were much larger than the sex gaps between white men and women within regions. For example, there was a 27 percent difference between how white men in the South voted vs white men on the Pacific Coast, but only a 2 percent difference between Southern white men and women, and a 5 percent gap between Pacific Coast white men and women (Table 2). Southern white men also voted 20 percent higher for Mr. Trump than Northeast white men, and 11 percent higher than white men in the Interior West. Southern white women outvoted white men for Mr. Trump in every region outside the South: by 18 percent over Northeast white men, and a crushing 25 percent over Pacific Coast white men.
There is no need to go through every region; readers can make the comparisons they find most interesting.
Discussion
The white vote is determined more by region than by sex. As noted, Southern white women voted for Mr. Trump in higher percentages than any group other than Southern white men. In the Midwest, Interior West, and Alaska, white women voted for Mr. Trump in higher percentages than both white men and women in the Northeast and on the Pacific Coast. In each region, whites of both sexes cluster together — much more so than whites as a whole nationwide, if you consider sex alone.
For example, the largest sex gap by region was in Alaska, at 11 percent, whereas the largest same-sex gaps between regions can be almost three times greater: 30 points between Southern and Pacific Coast white women and 27 percent between Southern and Pacific Coast white men. It doesn’t make sense to spend so much time after every election wondering why 5 to 10 percent fewer white women than men voted Republican, when there are such stark regional differences. Whites are far more divided by region than by sex (Table 2).
At the same time, to the extent there is a sex divide, it is greatest in the Northeast, where a small majority of white men voted for Mr. Trump while a majority of white women voted against him. The sharpest within-state sex gaps are also found there. We think this region is what gives the incorrect impression of a large, nationwide sex gap.
Voting patterns confirm that the South is the most conservative part of the country. Some say that the Northeast and Upper Midwest (as opposed to the Midwest as a whole) have purple and blue states, while the South is solidly red because the former regions have more large cities than in the South. This may have been a good explanation 50 years ago, but the South now has many large cities also, including some that vote heavily red.
Some have argued white transplants moving South have made the South redder. However, the Southern states that are notorious for having the most transplants (Texas, Florida, and North Carolina) have the lowest percentages of whites voting for Mr. Trump, whereas Alabama, Mississippi, and Louisiana, which have the fewest transplants, voted more solidly for him than any other states in the country. The South has the largest percentage of white people of founding stock, and the South tends to be the most patriotic part of the country. In our circles, patriotism is often criticized, but it can also be seen as honorable, and this also affects voting patterns.
We suspect that the Trump vote in the South is largely driven by the large number of evangelical Protestants, who are the religious group that votes most heavily Republican. In the 2016, 2018 and 2020 elections, white evangelical Protestants voted Republican by 61-, 64-, and 69-point margins, while white Catholics voted Republican by 33-, 20-, and 15-point margins. Religiously unaffiliated voters tilted Democrat by 41-, 53-, and 45-point margins. In 2020, avowed atheists supported Joe Biden over Donald Trump by a 76-point margin. Religious differences between whites are therefore much more politically decisive than sex differences. Half of Republicans are Protestants. White evangelical Protestants are 33 percent of Republican voters and are the base of the party. Secular Americans make up 45 percent of the Democratic Party and are that party’s base. In 2024, 62 percent of irreligious Americans considered themselves “very liberal” and only 11 percent considered themselves “very conservative.”
Kamala Harris won Vermont by a 32-point margin. Mr. Trump defeated Miss Harris in West Virginia by a 42-point margin. In Vermont, 41 percent of voters are religiously unaffiliated, and white Evangelicals hardly register in the statistics; in West Virginia, only 24 percent are religiously unaffiliated, and 36 percent are Evangelical. In general, blue states are largely Catholic and irreligious, while red states are Protestant. Swings among white Catholics in Rust Belt battleground states have been decisive in national elections in the Trump era.
In Virginia and Colorado, 83 percent and 72 percent, respectively, of white evangelicals voted for Mr. Trump, while 74 percent and 67 percent of irreligious whites voted for Miss Harris. In Washington and Oregon, 66 percent and 79 percent of white evangelicals voted for Mr. Trump, while 73 percent of irreligious whites voted for Miss Harris. The relative size of the white evangelical population and the religiously unaffiliated populations go a long way to explaining regional differences.
In defense of the Western states
There was a time when the Western states, even California, were conservative. Much of their population was descended from Southerners who went West. These states have, over the years, received white immigrants from bluer states, pushing them heavily Democrat. Otherwise, the region’s whites might have voted more like the South. Similar migration could threaten the political profile of white Southerners as well.
Colorado, in the Interior West, is a leftist anomaly for the region. It has been overrun with blue-state transplants over the years, vastly transforming its politics. In Colorado, 49 percent of white men voted for Trump, and 41 percent of white women. New Mexico had the second lowest Trump percentages in the region, with 52 percent of white men and 46 percent of white women. This may have to do with Hispanics who aren’t really white being counted as white. If these two states were removed from the Interior West data, the region would have been 65 percent Trump for white men and 59 percent for white women, putting them closer to the South than to any other region (Table 1).
Conclusion
Politically, whites are far more divided by region than by sex. Southern white men have more in common politically with Southern white women than they do with white men in other regions. Regional differences are largely a religious headcount, with the South being the most religious and most politically conservative region. Other regions are similar to the South politically, to the extent that they share heritage with the South as in parts of the Midwest and Interior West and perhaps even Alaska.
New England and the West Coast are the most irreligious parts of the country and had some of the lowest percentages of whites voting for Mr. Trump. The South is the most Protestant region, and white evangelicals are concentrated there.
Vermont and West Virginia are two of the whitest states, but couldn’t be more different in religious and cultural makeup, which clearly divides their politics. Although men generally voted more enthusiastically than women for Mr. Trump, region had a much stronger effect on voting patterns than sex, and the largest sex gaps were mostly concentrated in the Northeast. In the South — in Mississippi, Alabama, and Georgia, specifically — white women actually outvoted white men for Mr. Trump.